CodeX Energy drink survey analysis
Table of Contents
Introduction
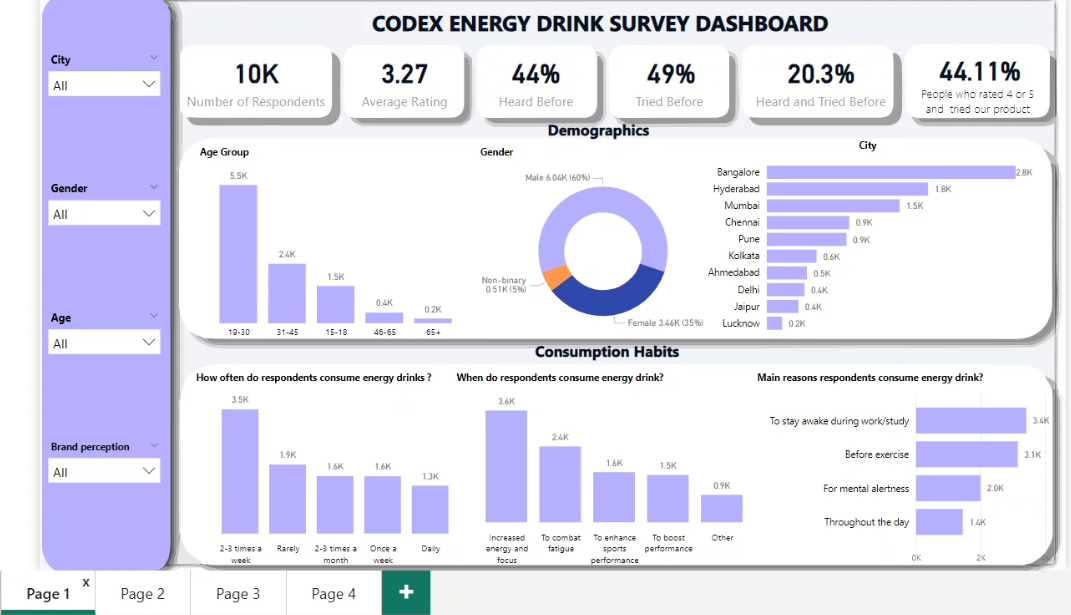
CodeX is a German beverage company that is aiming to make its mark in the Indian market. A few months ago, they launched their energy drink in 10 cities in India. Their Marketing team is responsible for increasing brand awareness, market share, and product development. They conducted a survey in those 10 cities and received results from 10,000 respondents.
Objective
-
What is the key pain point?
The Chief Marketing Officer wants to know what meaningful insights can be found in the survey collected and how they can help his team make decisive actions.
-
What is the solution?
-
I have to answer questions based on the data given.
-
To create a dashboard that provides insights about the survey questions’ responses. I will be focusing on:
- Marketing channels
- Purchase locations
- Typical consumption situations
- Expected price range of energy drink
- Time preferred to consume energy drinks
- Number of times energy drinks are consumed
Tools
Tool Purpose Python Exploring, cleaning, and analyzing the data Power BI Visualizing the data via interactive dashboards GitHub Hosting the project documentation and version control
-
Data Exploration
- These are my initial observations on the datasets given:
- There are no missing data points in all three datasets.
- The column Tried_before of the fact_survey_responses.csv dataset indicates if the respondents have tried our product or not. There is another column Taste_experience that allows respondents to give a rating on our product if they have tried it. It seems some respondents responded No to Tried_before while still giving a rating. So that has to be corrected.
- The column Reasons_preventing_trying of the fact_survey_responses.csv dataset indicates why respondents who answered No to the Tried_before column did not try our product. Respondents who answered Yes to the Tried_before column should not have responded to the Reasons_preventing_trying column. So that has to be corrected.
- The column Brand_perception of the fact_survey_responses.csv dataset indicates what respondents who answered Yes to the heard_before column think of our product. Respondents who answered No to the Heard_before column should not have any response in the Brand_perception column. This has to be corrected.
Data Cleaning
- The pandas and the numpy packages in the python programming language will be used to change the values of the columns to expected Null values. These are the conditions:
| Condition | Column Name | Expected Value |
|---|---|---|
| Tried_before = No | Taste_experience | NULL |
| Tried_before = Yes | Reasons_preventing_trying | NULL |
Below are the codes used to execute the cleaning of data:
not_tried_before = fact_survey_responses['Tried_before'] == 'No'
fact_survey_responses.loc[not_tried_before, 'Taste_experience'] = np.nan
tried_before = fact_survey_responses['Tried_before'] == 'Yes'
fact_survey_responses.loc[tried_before, 'Reasons_preventing_trying'] = np.nan
Data Analysis
Primary Insights
There are various questions provided by the marketing team that we are expected to answer:
-
1. Demographic Insights
-
1.a. Who prefers energy drinks more? (male/female/non-binary)
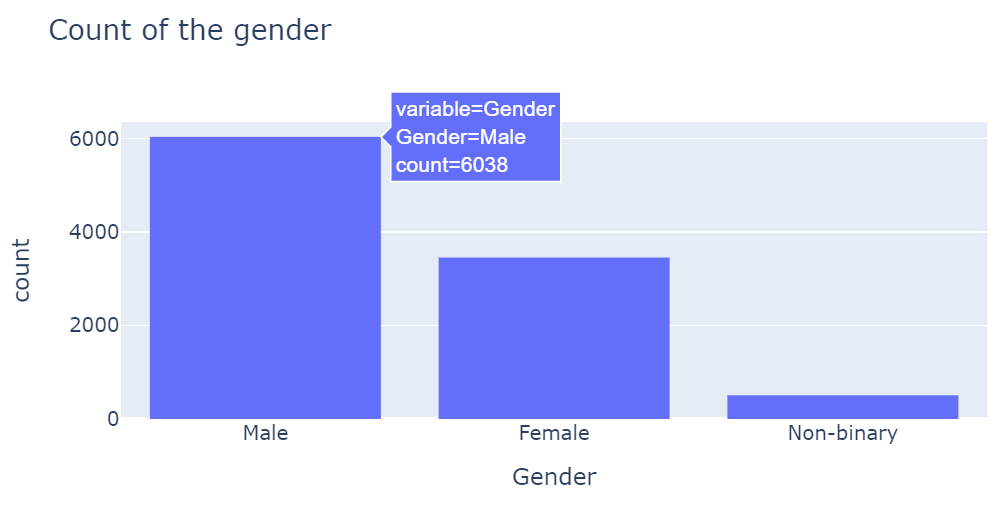
Looking into gender, 60% of the respondents are Male, about 35% are Female and 5% are Non-binary. More than half of our respondents are male. Therefore males prefer energy drinks. This corresponds with information found here, that more male take energy drinks than female. It also adds that males buy in more quantity than females.
-
1.b. What age group prefers energy drinks more?
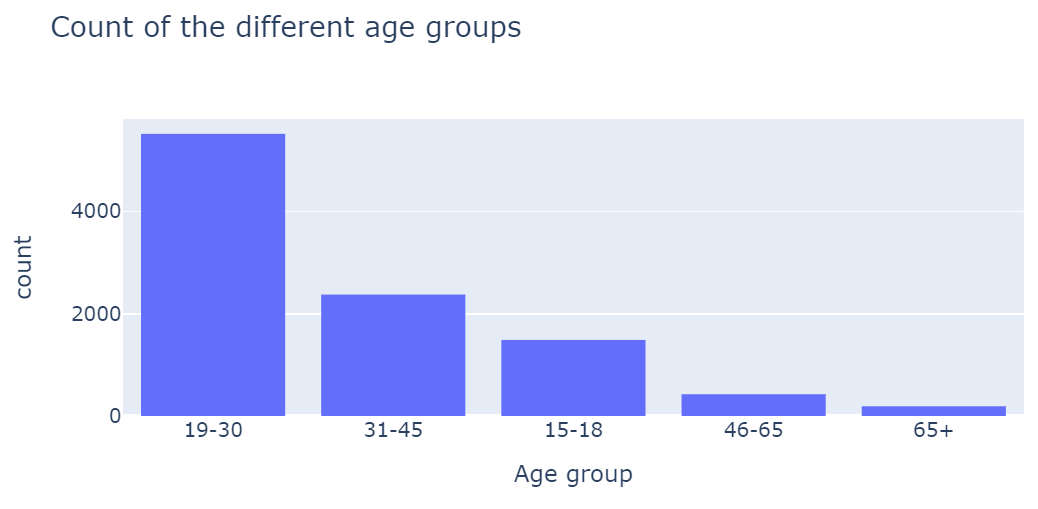
19-30 age group purchases our product the most. They account for 55% of the dataset. Followed by the 31-45 age group which is 24% and 15-18 age group which is 15%. It seems the 65+ age group purchased our product the least. It has to be taken into
consideration that the 15-18 age group has smaller bins than the other age ranges. According to the NIC, Men of the 18-34 age group consume the most energy drinks, and almost one-third of teens between 12-17 age group drink them regularly. -
1.c. Which type of marketing reaches the most Youth (15-30)?
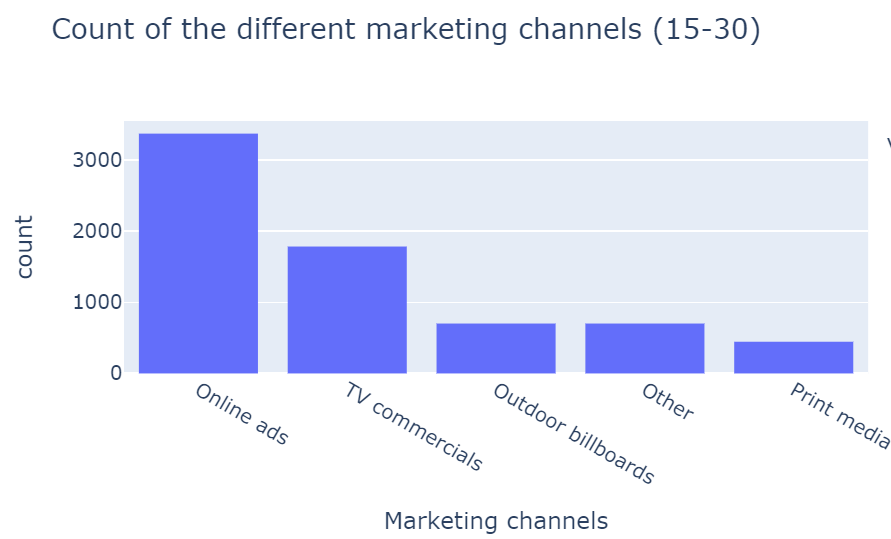
The best marketing channel for the 19-30 age range is Online ads which account for 48% of the respondents. The next marketing channel is TV Commercial which accounts for 25%. The worst marketing channel is Print Media which accounts for 6%.
-
- 2. Consumer Preferences
-
2.a. What are the preferred ingredients of energy drinks among respondents?
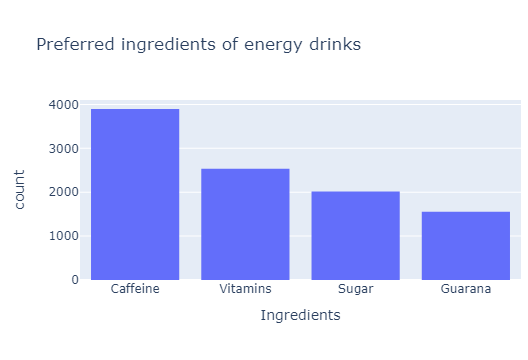
The top consumer preference is caffeine which accounts for 39% of our respondents, vitamins for 25%, and sugar for 20%.
-
2.b. What packaging preferences do respondents have for energy drinks?
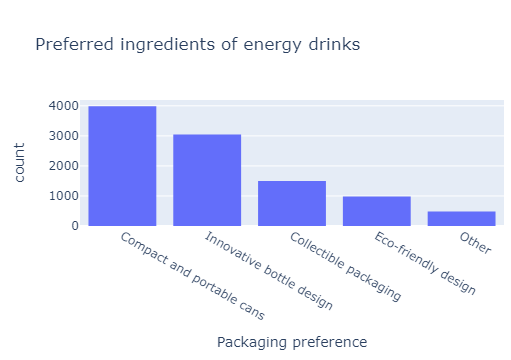
The top packaging preference is Compact and portable cans which accounts for 40% of respondents, Innovative bottle design accounts for 30%, Collectible packaging accounts for 15%.
-
- 3. Competition Analysis
-
3.a. Who are the current market leaders?
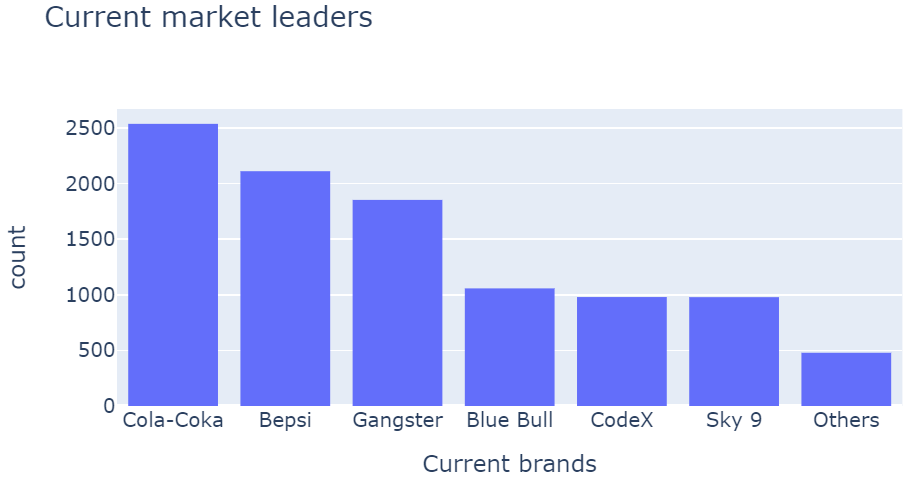
The top market leader is Cola-Coka which accounts for 25% of the respondents, Bepsi accounts for 21%, and Gangster accounts for 19%.
-
3.b. What are the primary reasons consumers prefer those brands over ours?
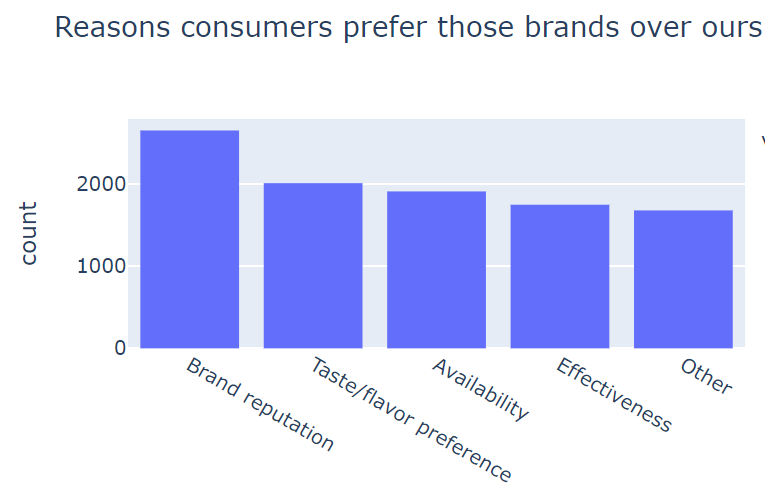
The primary reason respondents prefer to consume those brands is Brand reputation which accounts for 27% of the respondents, Taste/flavor preference accounts for 20%, and Availability accounts for 19%.
-
- 4. Marketing Channels and Brand Awareness
-
4.a. Which marketing channel can be used to reach more customers?
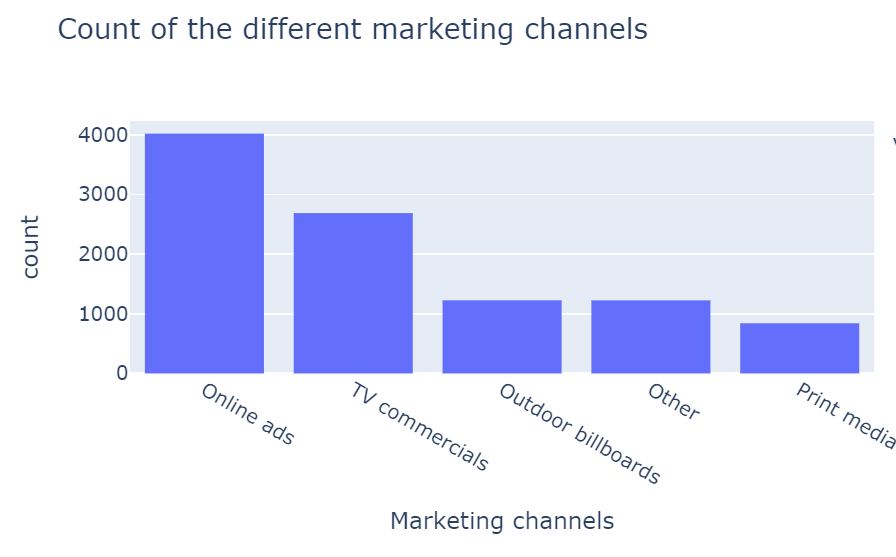
The most effective marketing channel is Online ads accounting for 40% of our respondents, TV commercials accounting for 27%, and Outdoor billboards accounting for 12%.
-
4.b. How effective are different marketing strategies and channels in reaching our customers? Our potential customers in this case refer to respondents who either heard or tried our product. I wanted to identify what marketing channels these respondents preferred.
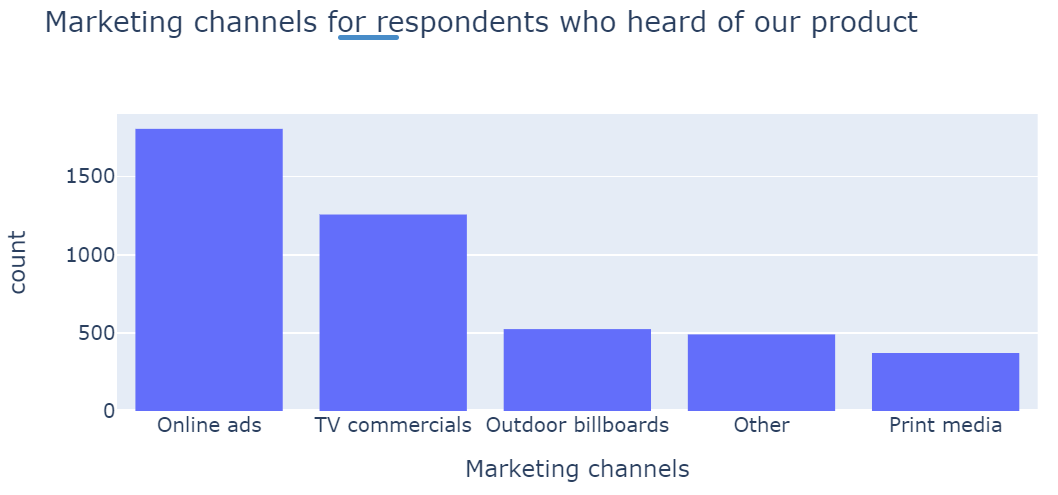
The top marketing channel is Online ads which account for 41% of respondents who heard about our product. TV commercials which account for 28%. Outdoor billboards which account for 12%.
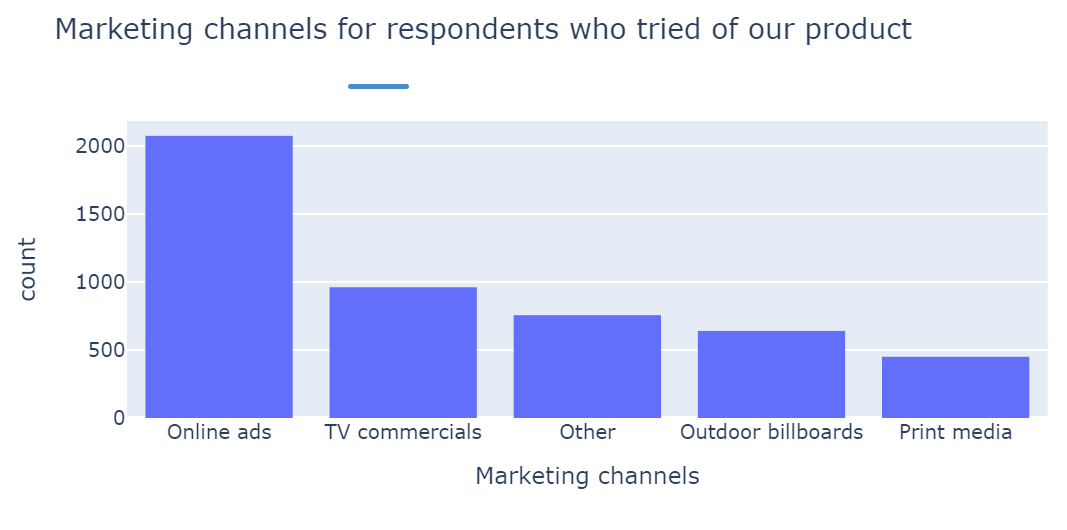
The top marketing channel is Online ads which accounts for 42% of respondents who tried our product. TV commercials which account for 20%. Other which accounts for 15%.
For respondents who heard of or tried our product, Online and TV commercials are the most effective marketing channels and they should be used.
-
- 5. Brand Penetration
-
5.a. What do people think about our brand? (overall rating)
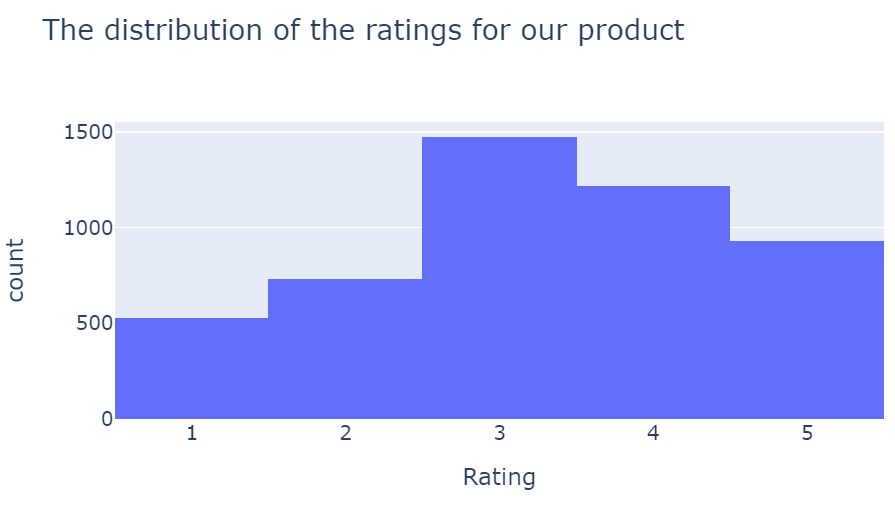
Nearly 50% of the respondents (4881) have tried our product. The distribution of the ratings above shows us that more respondents rated our product 3-5 rating compared to the 1-2 rating. The average rating is 3.3. Generally, as 3 is average, respondents generally think our product is slightly above average.
-
5.b. Which cities do we need to focus on?
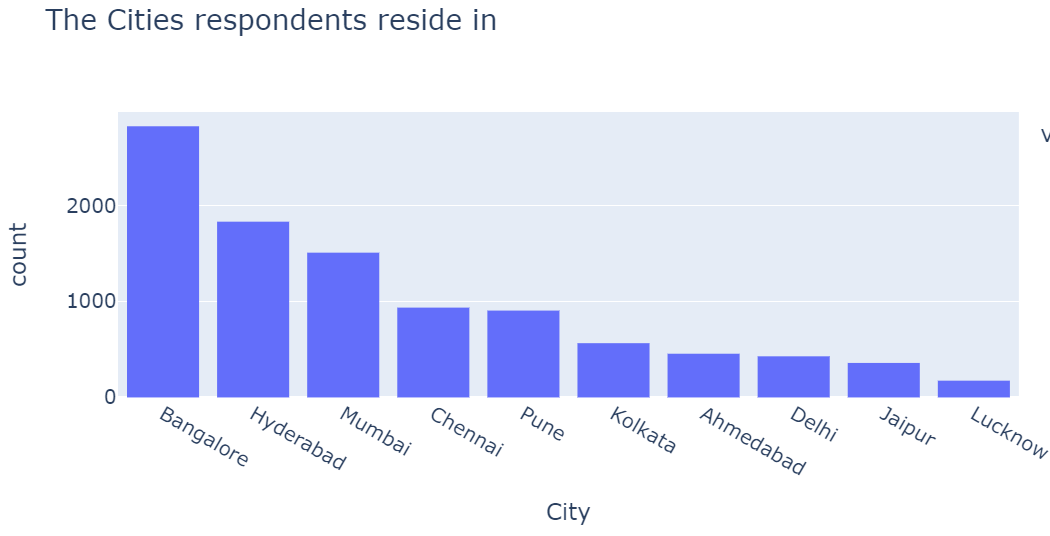
Focusing on cities where all respondents reside, Bangalore has the highest number of respondents accounting for 41% of respondents. Next is Hyberabad accounting for 18%. Then Mumbai accounting for 15%.
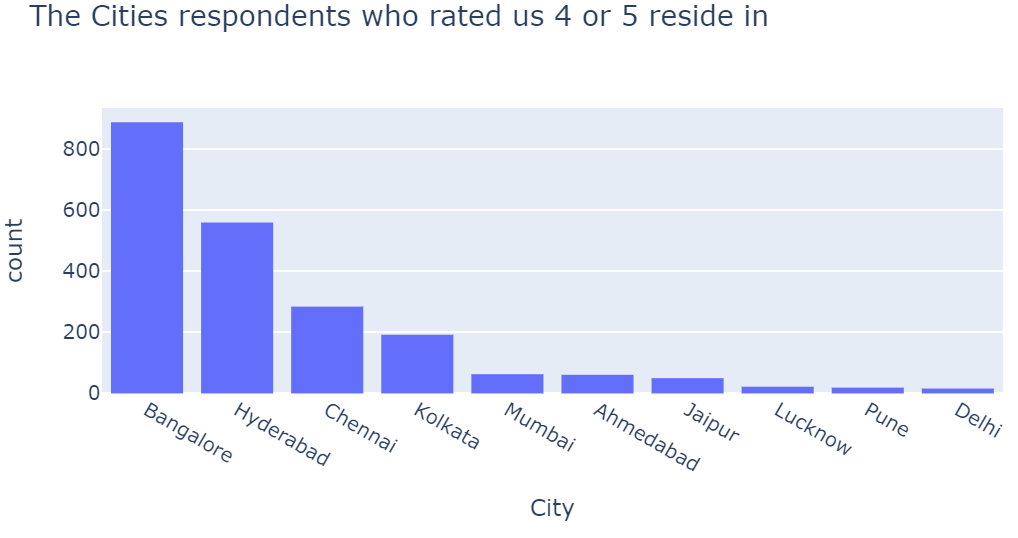
2153 respondents rated our product either 4 or 5. 41% of which live in Bangalore, 26% in Hyderabad, and 13% in Chennai.
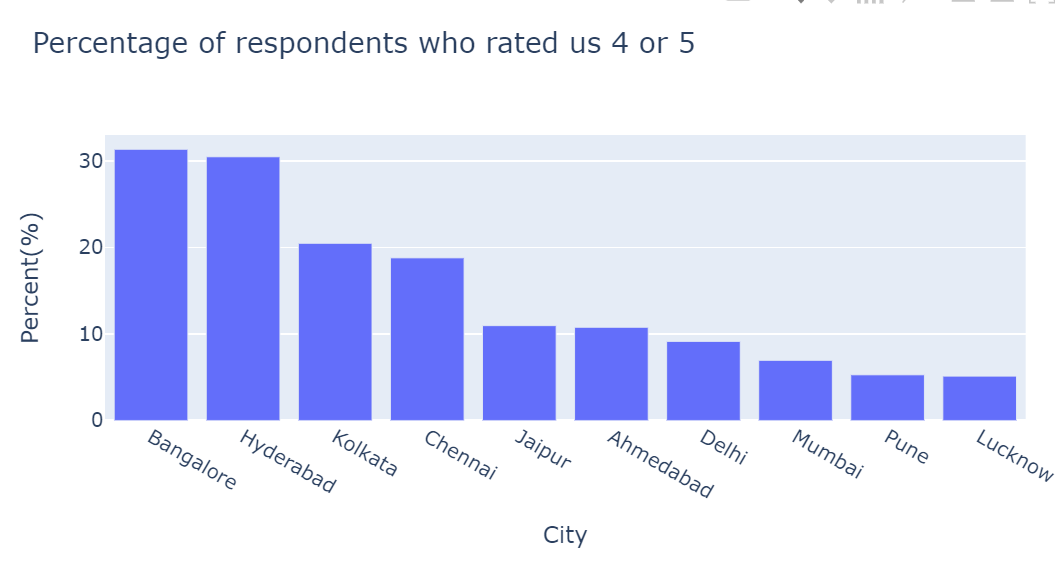
Finally, focus was made on the percentage of people who rated our product either 4 or 5 compared to the total number of their corresponding cities. As shown above, 31% of respondents from Bangalore rated our product a 4 or 5, 30% from Hyderabad, and 20% from Kolkata.
On the different criteria given, Bangalore and Hyderabad were at the top. I recommend we focus on these cities mainly. While sales made in the other cities will be closely monitored.
-
- 6. Purchase Behaviour
-
6.a. Where do respondents prefer to purchase energy drinks?
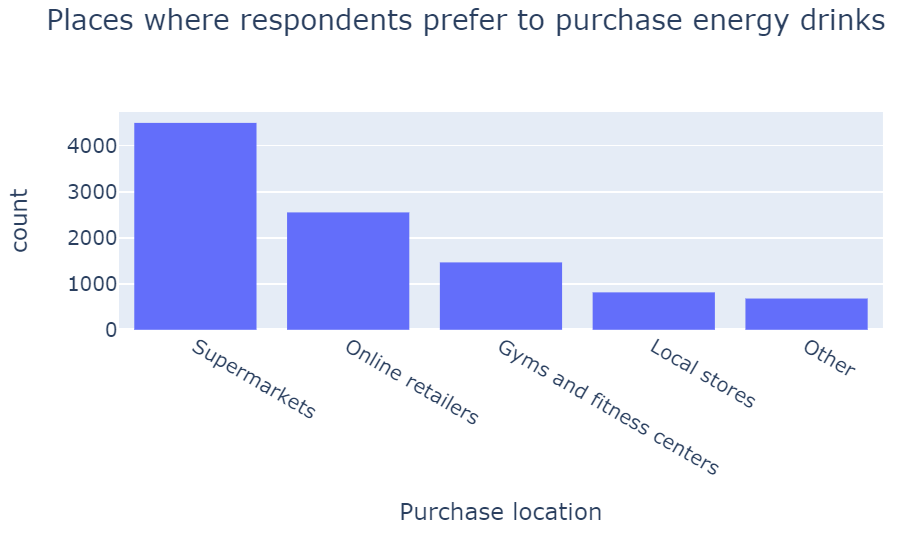
The most preferred location respondents prefer to purchase energy drinks is Supermarkets which accounts for 45% of the respondents. Next is Online retailers which accounts for 26%, and Gym and fitness centers which accounts for 15%.
-
6.b. What are the typical consumption situations for energy drinks among respondents?
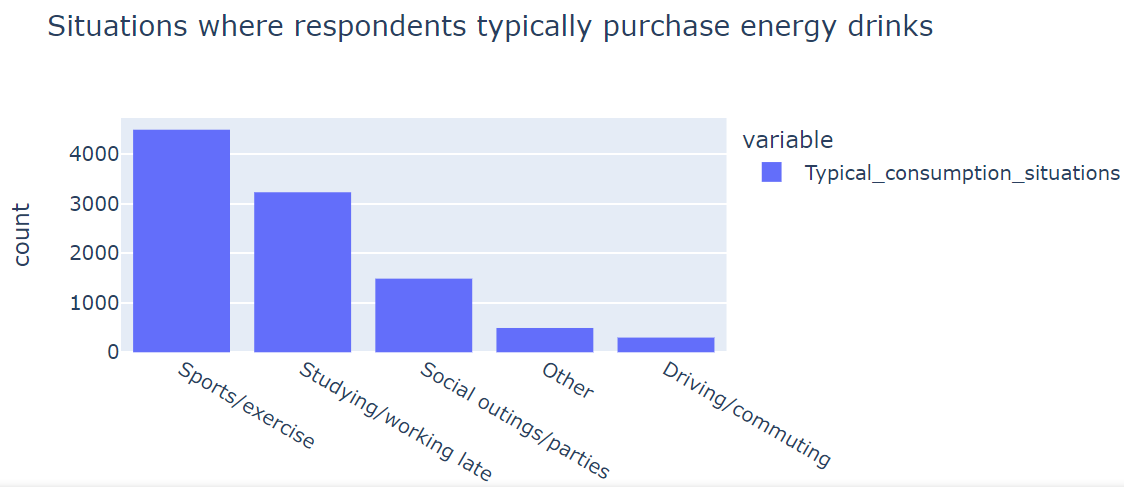
The situation that respondents typically consume energy drinks the most is Sports/exercise which accounts for 45% of respondents. Next is Studying/working which accounts for 32% and Social outings/parties which accounts for 15%.
-
6.c. What factors influence respondents’ purchase decisions, such as price range and limited edition packaging?
-
i. Price range
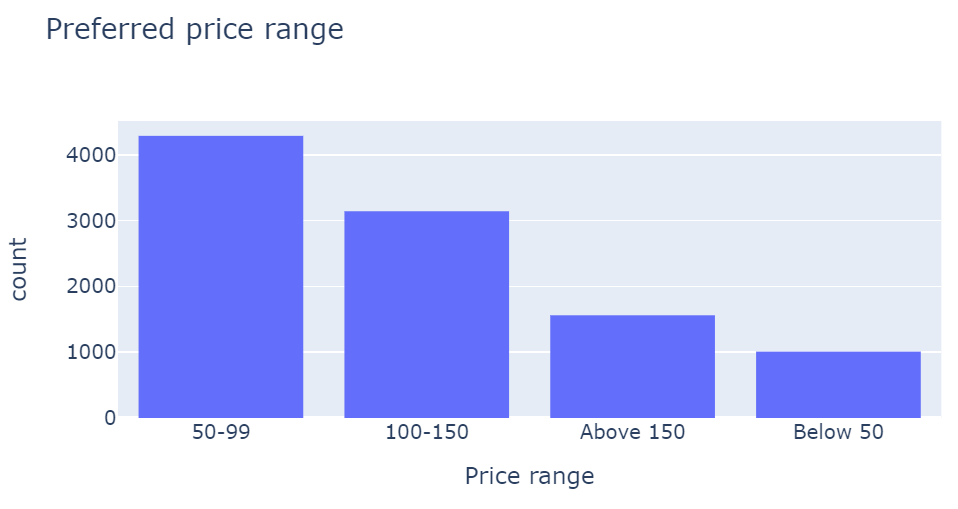
The most preferred price range for respondents is 50-99 which accounts for 43% of respondents. Next is 100-150 which accounts for 31% of respondents.
74% of respondents preferred the price range between 50-150.
-
ii. Limited edition packaging
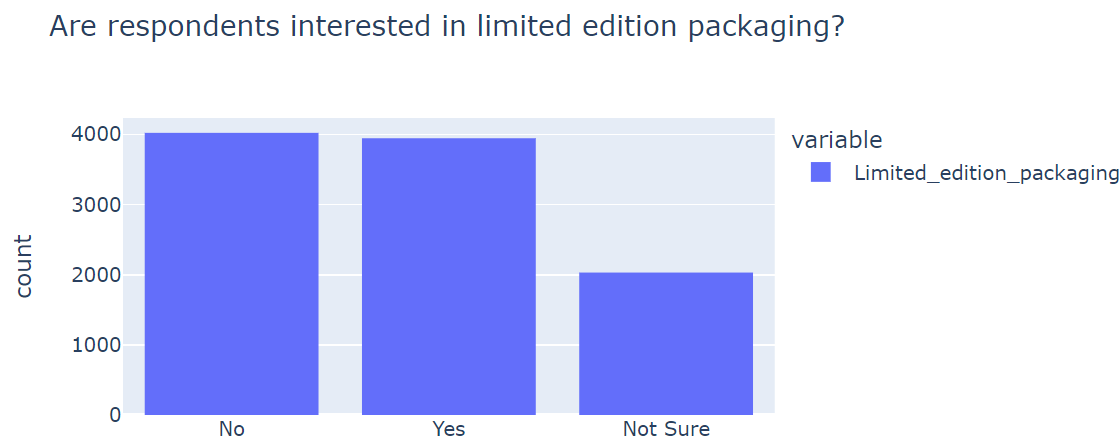
40% of the respondents answered Yes and 40% of the respondents answered No. 20% answered Not Sure.
Limited edition packaging involves making unique limited branded products for a brief period of time. Therefore, I recommended that our products should have limited edition packaging. 40% of respondents said Yes and limited edition packaging is not targeted to all of our customers.
-
-
- 7. Product Development
-
7.a. Which area of business should we focus more on our product development? (Branding/taste/availability)
Before deciding where to focus, it’s important to view what respondents think of our product.
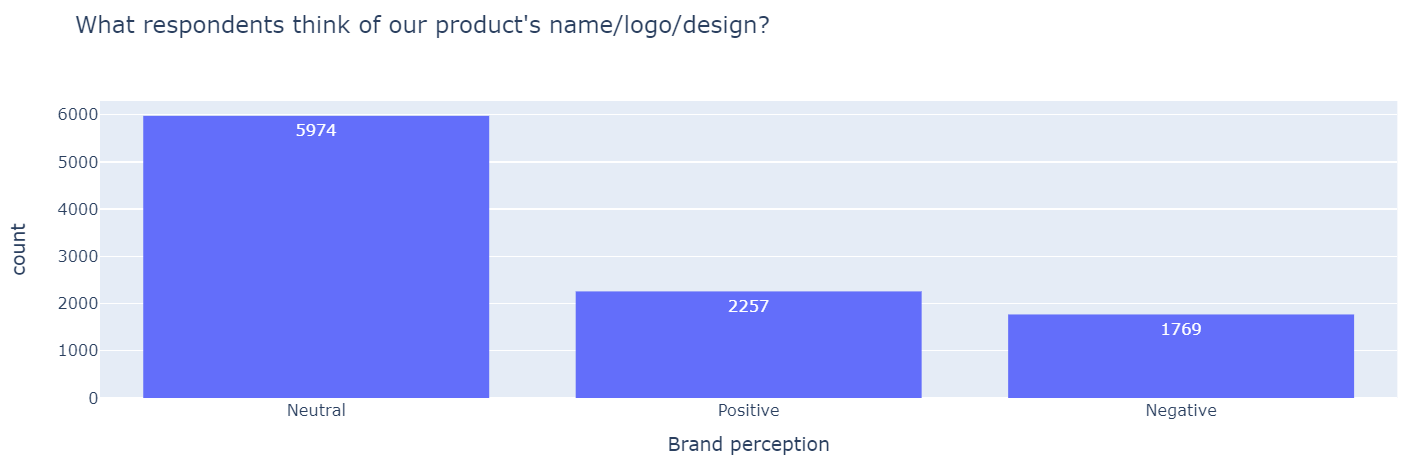
60% of people had Neutral thoughts about our product. 23% of people had Positive thoughts about our product. 17% of people had Negative thoughts about our product. Generally, respondents think our products are just okay which aligns with the respondents’ average rating of our product of 3.3.
Next, we focus on what reasons our respondents have for not trying our product.
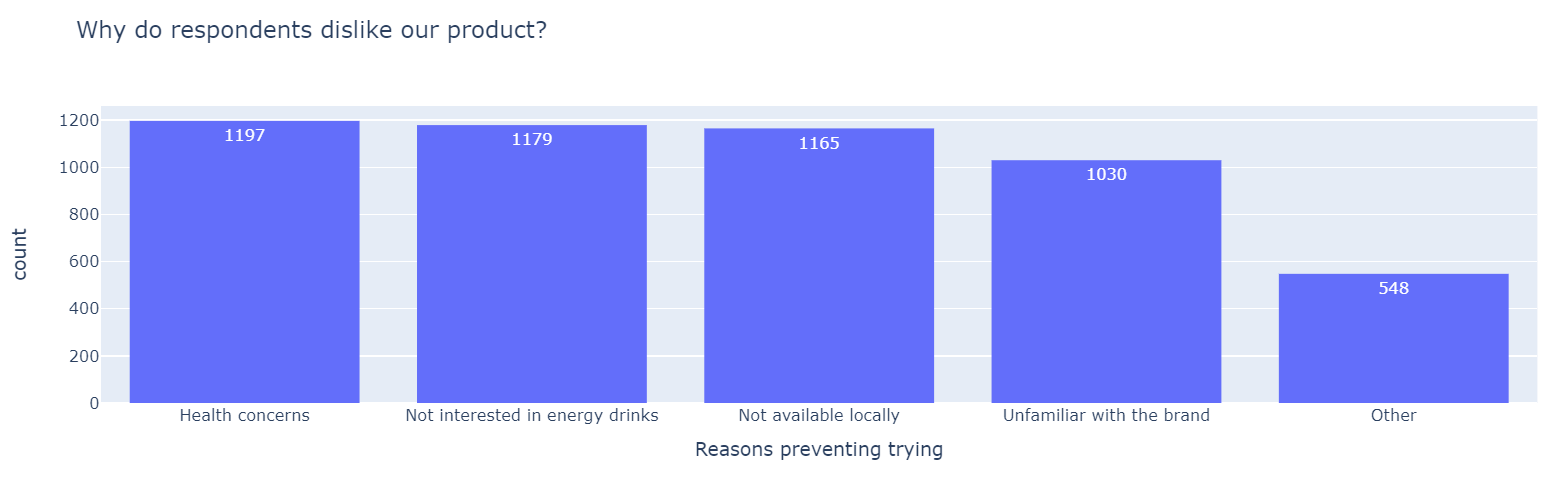
There are 5119 respondents who have not tried our product. Health concerns is the top reason 23% of these respondents dislike our product. Next is Not interested in energy drinks which accounts for 23%, Not available locally which accounts for 23% and Unfamiliar with the brand which accounts 20%.
This publication focuses on the benefits and adverse effects of energy drinks. Recommendations
- I recommend the company makes healthier versions of our product to fit these needs.
- I recommend the company increases its advertisements of our product
I also looked into why respondents were choosing other brands.
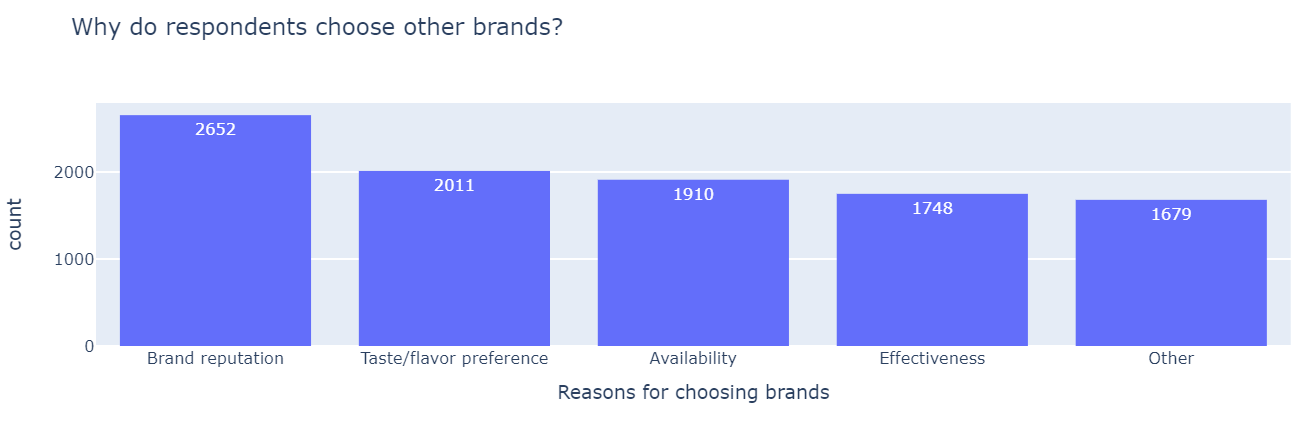
The top reason respondents choose other brands is Brand reputation which accounts for 27% of the respondents. Next is Taste/flavor preference which accounts for 20% and Availability which accounts for 19%.
Also, I looked into what improvements respondents desired.
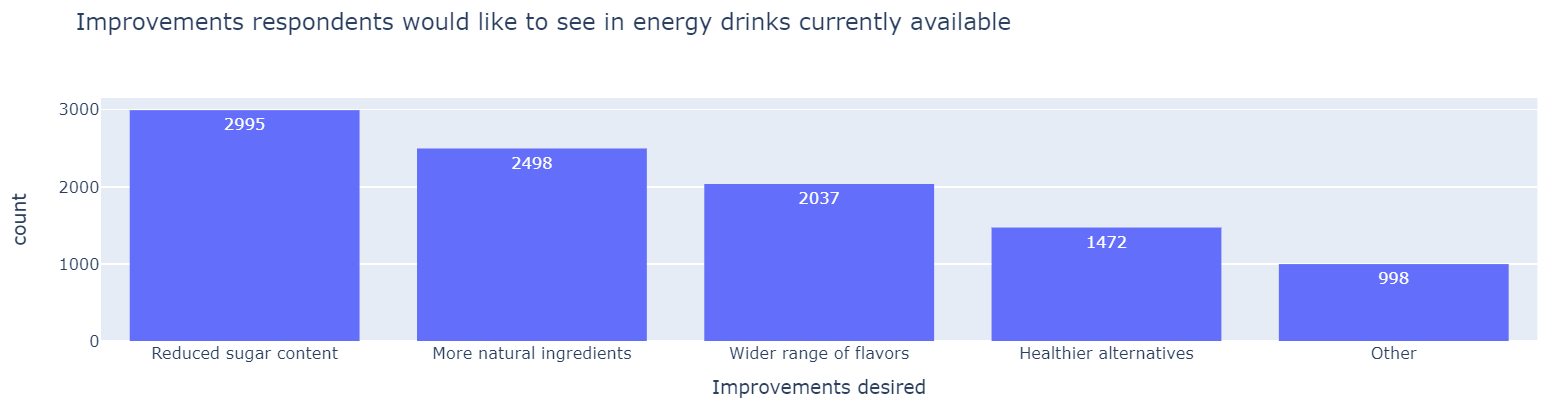
Reduced sugar content is the top improvement respondents would like to see in energy drinks which accounts for 30%. More natural ingredients accounts for 25% and Wider range of flavors accounts for 20%.
Lastly, I looked into what packaging respondents preferred.
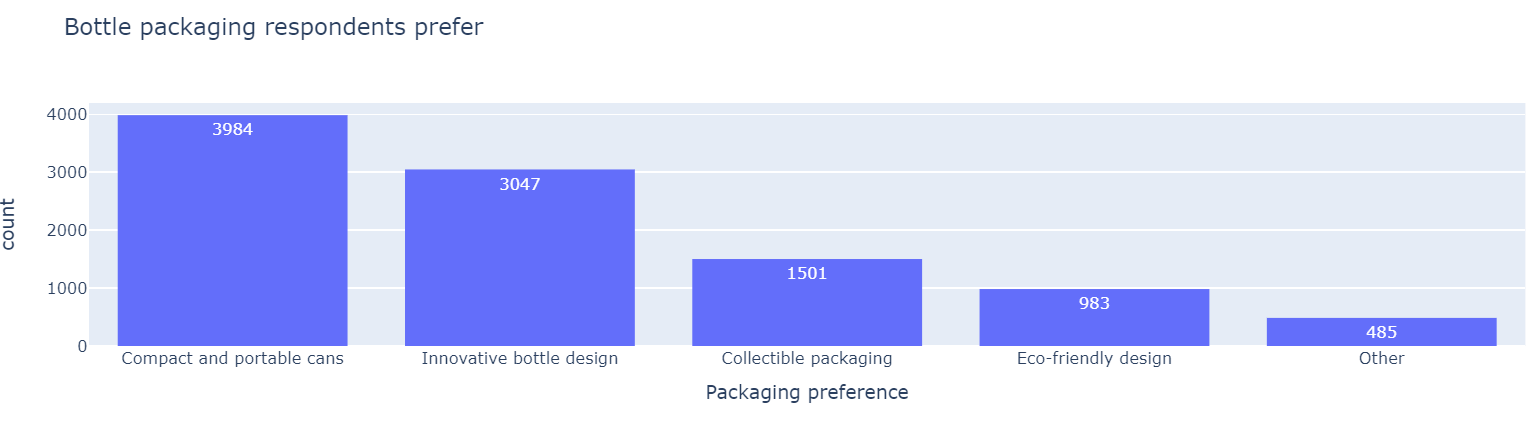
Respondents prefer Compact and portable cans which account for 40%. Next is Innovative bottle design which accounts for 30% and Collectible packaging which accounts for 15%.
-
Secondary Insights
-
How many times a week do respondents consume energy drinks?
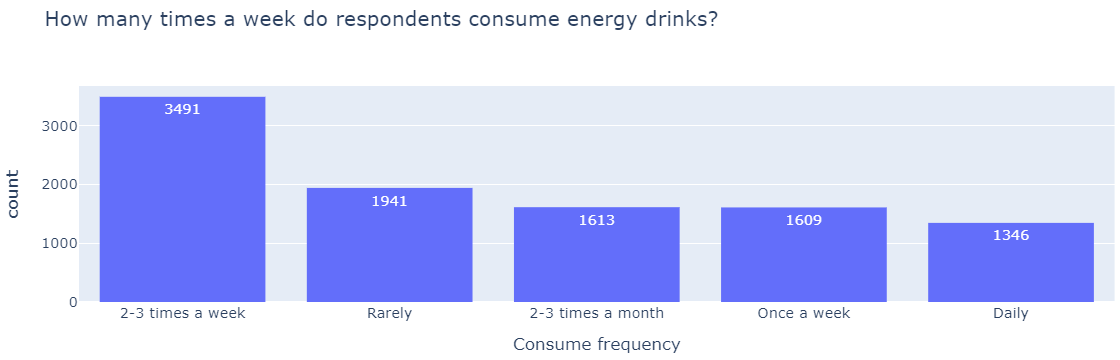
2-3 times a week is the top most response which accounts for 35% of the respondents. Next is Rarely which accounts for 20%, and 2-3 times a month which accounts for 16%.
-
When do respondents consume energy drinks?
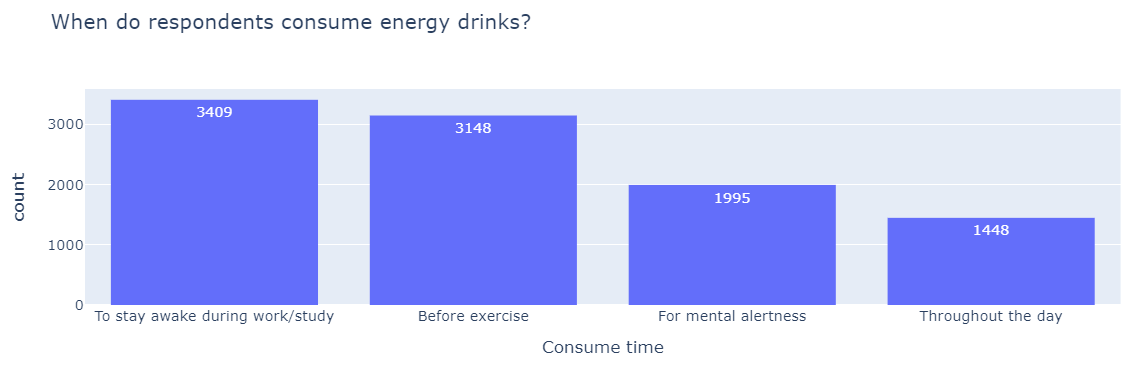
To stay awake during work/study is the top response which accounts for 34% of respondents. Next is Before exercise which accounts for 31% of respondents, and For mental alertness which accounts for 20% of respondents.
Recommendation
- Our products should be advertised mainly to 19-30 men as they are our primary customers.
- Online Ads and TV commercials should be used for advertisements.
- I recommend Bangalore and Hyderabad as cities to focus advertisements in. These cities are where the highest portion of our respondents reside. These cities have the highest number of respondents who rated our product above average.
- The price of our product should be between 50-150, as 74% of respondents preferred these price ranges.
- I recommend selling our products in Supermarkets, Online retailers, and Gym and fitness centers. These locations account for 86% of the respondents response as regards location of purchase of energy drinks.
- 40% of the respondents said Yes to limited edition packaging which is nearly half of our respondents. I recommend we provide these packages with the intention of targeting these customers.
Dashboard